|
|
||||
|
LEAD Action News
Vol
2 no 4
Spring 1994.
ISSN 1324-6011 |
||||
|
About Us
|
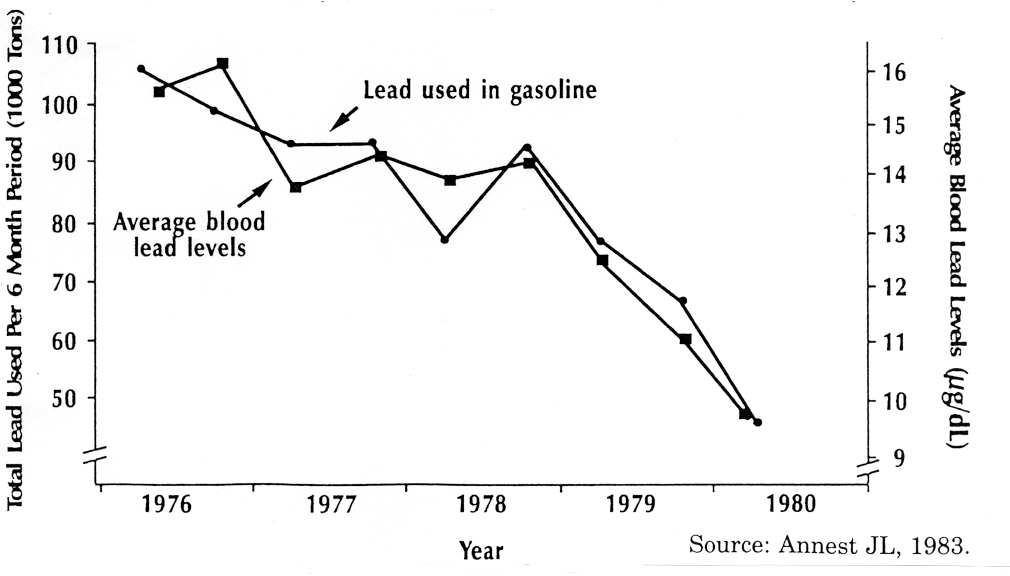
A Clear Case Against Lead in Petrol by Lawrence McGinty The following is an extract from an article in New Scientist 27 May 1982, Monitor Section In [an] Italian study (in Turin and Piedmont), lead from the Broken Hill mine in Australia was put in petrol sold in the area for almost two years between 1977 and 1979. This lead has a different ratio of the isotopes lead-206 and lead-207 from lead from other sources. So researchers could find out how much of the lead in people's bodies came from this source merely by measuring changes in the isotopic ratios of the lead in their blood. They found that the ratio characteristic of Broken Hill lead dropped by 30 percent for people in Turin after 1979, suggesting that lead from petrol makes up a similar percentage of the total burden of lead in the body. Dr Joseph Annest from the US National Center for Health Statistics in Hyattsville, Maryland told CLEAR's symposium of similar results from the second US National Health and Nutrition Examination Survey, which covered 27,801 people between 1976 and 1980. The Center for Disease Control in Atlanta analysed samples of blood from 9,933 of these people for lead. Over the four years of the survey, the levels of lead in people's blood dropped significantly and almost exactly in step with the decline in the amount of lead added to petrol, following initiatives to encourage cars to run on unleaded petrol begun in 1975 (see graph). Four factors make this evidence, produced by Dr Vernon Houk of the Center for Disease Control, especially reliable and convincing. First, the correlation between lead levels in people's blood and the amount of lead added to petrol is very close: the correlation coefficient is 0-95. Secondly, the correlation also held in almost every case when Houk sub-divided the sample into groups defined by age, sex, race, family income, season, region and type (urban or rural) of residence. Thirdly, a careful control programme showed that the trends were not due to changes in laboratory practice. Throughout the four years of the survey, its designers gave the analysts control samples of bovine blood dosed with a known amount of lead, which they analysed blind. There were no chronological trends in these analyses. Fourthly, the survey is a massive affair, with the result that numbers in most of the sub-groups are large enough to make the results statistically significant.
Graph: In 1975, the US government began to phase out the use of lead in petrol. In the following years, the drop in the amount of lead used was matched by a dramatic drop in the levels of lead in peoples blood. The proportion of blood lead that comes from petrol now seems higher than was thought. |
|||
|
About
Us |
bell
system lead poisoning |
Contact Us
| Council
LEAD Project | egroups | Library
- Fact Sheets | Home
Page | Media Releases Newsletters | Q & A | Referral lists | Reports | Site Map | Slide Shows - Films | Subscription | Useful Links | Search this Site |
||||
|
Last
Updated 14 November 2012
|
||||