 |
|||
| LEAD Action News Volume
12 Number 3, May 2012, ISSN 1324-6011 Incorporating Lead Aware Times ( ISSN 1440-4966) and Lead Advisory Service News (ISSN 1440-0561) The Journal of The LEAD (Lead Education and Abatement Design) Group Inc. |
|||
|
About Us
|
Blood Lead Levels for 1-5 Year Olds in the US over Time, compared to in Australia in 1995 By Elizabeth O'Brien, BSc, Grad Dip in Educational Studies (Health Educ’n), Manager, Global Lead Advice & Support Service (GLASS) run by The LEAD Group Inc. Australia Only one study has been done in Australia to indicate what "normal levels" / average blood lead levels are for all ages but it was only done for children aged 1-4 yrs and it has not been repeated to find out the trend over time nor in response to public health policies such as the phasing out of leaded petrol. The blood sampling for that study was done in 1995 and the results published in 1996. A summary of the results was originally web-published by the Australian federal environment agency at www.ea.gov.au/atmosphere/airquality/lead/leadsurvey.html , but now can only be found on The LEAD Group’s (a non-government charity) website, at Summary_Lead_in_Australian_Children.pdf and includes the following summary by Donovan et al: "The average value (mean) for all samples was 5.8 μg/dL [micrograms per decilitre] (0.28 μmol/L [micromoles/litre). There was a slight variation in the mean values for different States/Territories with the lowest value recorded in the Australian Capital Territory and highest in the Northern Territory, although the sample size was much lower in both these Territories.” The full report "Lead in Australian Children: Report on the National Survey of Lead in Children" was only ever published in hard copy by the government and is only web-published, again by The LEAD Group Inc, at Lead_in_Australian_children.pdf and reveals: "the arithmetic mean blood lead level was 0.277 µmol/L (5.72 µg/dL)...The geometric mean blood lead level was 0.244 µmol/L (5.05 µg/dL)...The lowest mean levels were found in the Australian Capital Territory, where the areas sampled were mainly newly settled, and only one CD [Census Collector District] had been settled when significant concentrations of lead was used in house paint. The mean levels were lower in Queensland and Victoria than in other States. The highest mean blood lead levels were from the Northern Territory and South Australia.” Table 10 in the full report shows the [arithmetic] mean blood lead level for Australian 1-4 year olds in 1995 was 0.28 µmol/L [equivalent to 5.8 µg/dL] and for the ACT was 0.22 µmol/L [equivalent to 4.6 µg/dL] and for the Northern Territory was 0.30 µmol/L [6.2 µg/dL]. In the USA, the National Health And Nutrition Examination Surveys (NHANES) - a series of large-scale national blood lead surveys, has found a trend of decreasing blood lead levels in all ages over time, and the updated tables of blood lead levels for the most recent NHANES testing, show that 1-5 year olds in the US had the following geometric mean blood lead levels in the stated survey (blood collection) years:
(See page 136 of the free full article downloadable as a pdf from http://www.cdc.gov/exposurereport/pdf/FourthReport_UpdatedTables_Feb2012.pdf ) The most recent analysis of blood lead trends in the NHANES series, for which blood lead sampling was done between 1999 and 2002, found a geometric mean blood lead level for children aged 1-5 yrs of 1.9 µg/dL (1.8 µg/dL for white non-Hispanic children) compared to the geometric mean of 2.7 µg/dL (2.3 µg/dL for white non-Hispanic children) from NHANES 1991-1994 (sampling years). (Reference: Table 2 in "Blood Lead Levels --- United States, 1999--2002 [NHANES IV] at www.cdc.gov/mmwr/preview/mmwrhtml/mm5420a5.htm ) This compares to an average level of 0.66 µmol/L [13.7 µg/dL]) for non-Hispanic white children and 0.97 µmol/L [20.2 µg/dL]) for non-Hispanic black children geometric mean blood lead levels for 1-5 yr olds in the first (1976-1980) NHANES round. According to Pirkle et al (1998), in the USA: “Mean blood lead levels of children aged 1 to 5 years declined 77% (0.66 to 0.15 µmol/L [13.7 to 3.2 micrograms/dL]) for non-Hispanic white children and 72% (0.97 to 0.27 µmol/L [20.2 to 5.6 micrograms/dL]) for non-Hispanic black children… From 1976 to 1990, the amount of lead in gasoline decreased by 99.8% (18). In 1980, 47% of food and soft-drink cans were lead soldered. By 1991, lead-soldered food and soft-drink cans were no longer manufactured in the United States (20,21). In addition, treatment of water to make it less corrosive to pipes, regulations to protect workers from lead exposure, and childhood lead poisoning prevention programs have helped to decrease lead exposure.” And they further concluded (in 1998), that: “Lead poisoning prevention programs should target high-risk persons, such as children who live in old homes, children of minority groups, and children living in families with low income… The major cause of the observed decline in blood lead levels is most likely the removal of 99.8% of lead from gasoline and the removal of lead from soldered cans. Although these data indicate major progress in reducing lead exposure, they also show that the same sociodemographic factors continue to be associated with higher blood lead levels, including younger age, male sex, non-Hispanic black race/ethnicity, and low income level. Future efforts to remove other lead sources (e.g., paint, dust, and soil) are needed but will be more difficult than removing lead from gasoline and soldered cans.” (See the free full article downloadable as a pdf Exposure of the U.S. population to lead, 1991-1994 J L. Pirkle, R B. Kaufmann, D J. Brody, T. Hickman, E W. Gunter, D C. Paschal. Environmental Health Perspectives . Volume 106, Number 11, November 1998 )
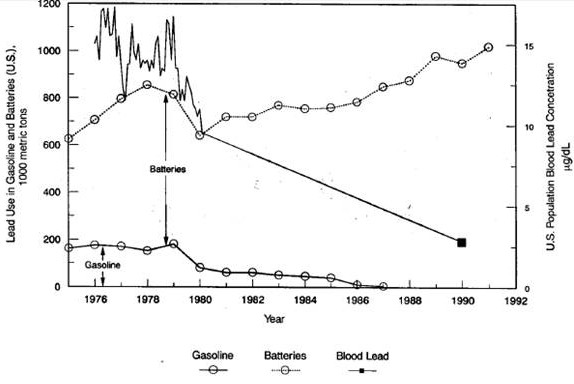
Figure 5 Annual U.S. lead use in gasoline and batteries and U.S. population blood lead levels from 1975 to 1990. Battery data are from U.S. Bureau of Mines 1993 and 1995. Gasoline data are from Nriagu 1990. Both the battery and the gasoline data are referenced to the x-axis: they are not shown additively. Blood lead data are from NHANES-II (Annest et al. 1983) and NHANES-III (Pirkle et al. 1994). NHANES-II data are 28-day averages from February 1976 to February 1980 ( Annest et al. 1983 figure I). The single NHANES-III blood-lead data point at 1990 is an average for 1988 to 1991. The dotted line connecting the NHANES II time series with the single NHANES III data point is a only a guide to the eye: there are no intermediate data points. “Figure 5 summarizes the record from 1975 to 1990 for the United States, showing the consumption of lead in gasoline additives and batteries, along with the average blood lead levels in the population. The use of lead in batteries has increased, although not steadily, and lead in automotive gasoline has disappeared, while population blood lead levels have plummeted.” Reference for above graph and quote: Robert Socolow, Valerie Thomas, Center for Energy and Environmental Studies, Princeton University, Princeton, New Jersey, USA. The Industrial Ecology of Lead and Electric Vehicles journal of Industrial Ecology Volume 1, Number 1. Copyright 1997 by the Massachusetts Institute of Technology and Yale University Of all the lead-related government policies mentioned above, the only other one which can be graphed for both the USA and Australia, is the phase-out of leaded petrol, because it is the only one with clear start and finish years in both countries: 1970 – US Environmental Protection Agency (EPA) orders introduction of unleaded gasoline and issues an order for lead-gasoline-free cars by 1975, thus beginning the world’s first national phase-out of leaded petrol. 1995 - US phases out leaded gasoline for road-use vehicles. 1985 – unleaded petrol is introduced in to Australia. By 1986, all new vehicles were required to have a catalytic converter and run on unleaded petrol (to prevent lead poisoning of the catalytic converter). 2002 – Australia phases out leaded petrol for road-use vehicles. I am certain that an analysis of blood lead trends in the US in relation to regulations and other policies controlling lead in paint, soil and dust, will demonstrate that they too have had a significant impact on US blood lead levels, especially of pre-schoolers. Please refer to the graph above. Based on the rate of decrease of blood lead levels of US 1-5 yr old children over the period of lead gasoline phase-out, and cessation of manufacture in the US of lead-soldered food cans, and knowing that leaded petrol was phased out in Australia by 1st January 2002, I would therefore guess that Australia's 1-5 yr old children's mean blood lead levels today are lower than they were in 1995, but higher than the mean in the USA where leaded paint, soil and dust are highly regulated. See for instance, http://www.epa.gov/lead/pubs/renovation.htm But we'd need another national survey to confirm that Australian blood lead levels have declined, and to determine that lead paint, soil and dust management should continue to be as unregulated as they are at present. Looking at the blood lead levels of people older than 5 years in the USA, and the research on health effects of even low blood lead levels like 2 µg/dL, I am also highly concerned to know the range and mean blood lead levels of all ages of Australians, and for this we need a national blood lead survey of all ages. |
||
|
About
Us |
bell
system lead poisoning |
Contact Us
| Council
LEAD Project | egroups | Library
- Fact Sheets | Home
Page | Media Releases Newsletters | Q & A | Referral lists | Reports | Site Map | Slide Shows - Films | Subscription | Useful Links | Search this Site |
|||
| Privacy Policy | Disclaimer | |||
|
Last
Updated 08 June 2012
Copyright © The LEAD Group Inc. 1991- 2012 PO Box 161 Summer Hill NSW 2130 Australia Phone: +61 2 9716 0014 |
|||